
Kansas City, Missouri has some of the most recognizable seasonal weather in the central United States. It is a city where winter can feel genuinely cold, spring can turn stormy and unpredictable, summer can become hot and humid, and fall often feels like the most comfortable stretch of the year.
Because Kansas City sits far inland, the city’s weather is shaped less by ocean moderation and more by the constant movement of continental air masses, which gives the city a climate with strong seasonal contrast, quick shifts, and a level of weather variety that makes it an excellent subject for a long-form climate guide.
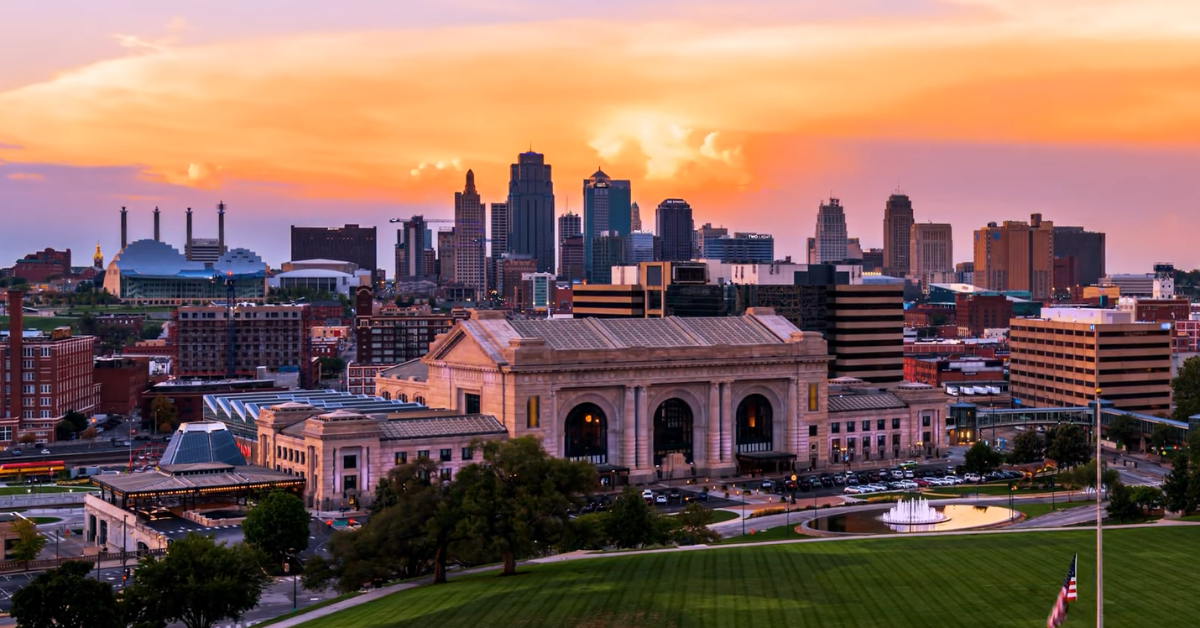
Kansas City is located on the Missouri River at the confluence with the Kansas River, and the city is contiguous with Kansas City, Kansas.
That river-crossing location and borderland geography help explain why the region sits at the meeting point of several different weather influences.
In practical terms, Kansas City weather is never boring. It is not a city with one stable climate mood. It is a place where cold air from the north, warm humid air from the south, and dry air from the Plains can all affect the forecast within the same week.
Kansas City weather at a glance
Kansas City has a continental climate with humid summer characteristics. The city’s summers as hot, muggy, and wet, and its winters as very cold, snowy, and windy.
The temperatures over the year typically vary from about 24°F to 90°F, with only rare excursions below 7°F or above 99°F.
NOAA’s climate-normal system is the official U.S. framework for representing typical conditions over a 30-year period, which is why climate-guided articles like this one are best built from those long-term averages rather than from any single year’s weather.
Climate snapshot
| Climate Metric | Typical Value |
|---|---|
| Average annual temperature | About 57°F |
| Coldest month | January |
| Hottest month | July |
| Annual precipitation | About 38 inches |
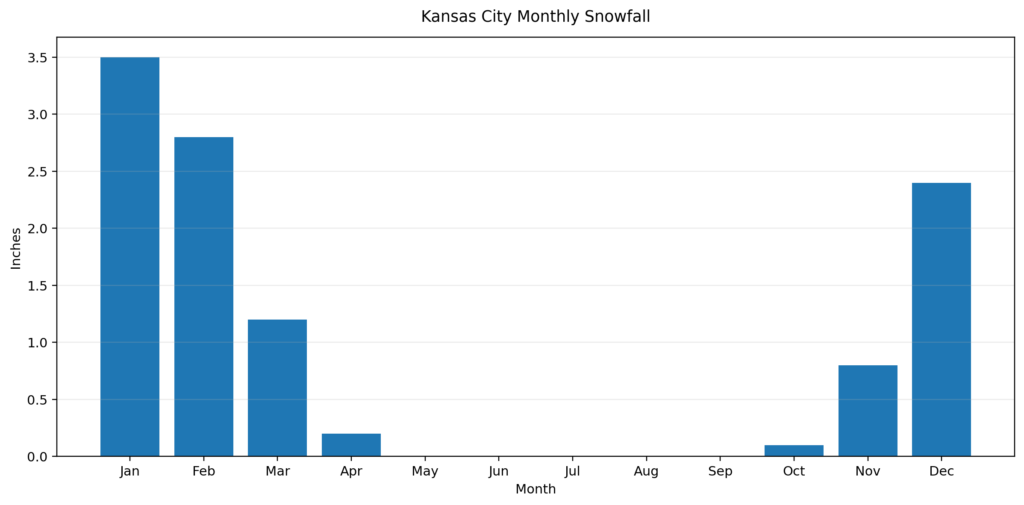
| Annual snowfall | About 11 inches |
| Sunshine per year | About 2,810 hours |
| General climate type | Continental / humid continental |
This mix is exactly what gives Kansas City its identity. It is warm enough in summer to support long outdoor days, cold enough in winter to feel like a true Midwest city, and storm-prone enough in spring to keep severe-weather awareness important.
Why Kansas City weather changes so quickly
Kansas City sits in a zone where different air masses collide. Cold Arctic air can push down from Canada, warm moisture-laden air can rise north from the Gulf of Mexico, and dry continental air can sweep in from the west.
When those systems interact, the result is unstable weather, which is why the city can jump from a cool morning to a warm afternoon and then into thunderstorms by evening.
That collision of air masses is also why spring weather is especially changeable, and why the region is known for severe thunderstorms and tornado risk. The tornadoes are associated with violent rotating storms and are most closely tied to the kind of instability common across the central U.S. in the warm season.
This matters because Kansas City weather is not just “hot in summer and cold in winter.”
It is a place where the transitions between seasons are abrupt, and those transitions create much of the city’s weather personality; making it one of the reasons spring and early summer often feel busy and unsettled, while fall tends to feel calmer and more predictable.
Kansas City location and geography
Kansas City, Missouri lies in western Missouri and sits on the Missouri River at the confluence with the Kansas River. It is contiguous with Kansas City, Kansas, creating a large metro area that spans both sides of the state line.
Kansas City, Missouri is an important city on the Missouri River, while also noting the broader urban complex that stretches across the Missouri-Kansas border.
The river setting is not just a map detail. It matters for local weather, flooding history, humidity, and the way storm systems move through the region.
Because Kansas City is located far from any ocean, it does not benefit from the smoothing effect that coastal cities enjoy. Coastal places often have milder temperature swings because water heats and cools slowly. Kansas City does not have that buffer.
That is one reason summer heat can feel intense and winter cold can feel more sudden. The city’s inland position gives it a more pronounced continental feel than many travelers expect.
Annual weather pattern in Kansas City
The weather pattern in Kansas City is easiest to understand as four distinct seasons with very different moods. Winter brings cold and wind. Spring brings rainfall and storm instability.
Summer brings heat, humidity, and thunderstorms. Fall brings cooler temperatures and the most balanced conditions of the year. The year-round climate captures that pattern clearly, including seasonal changes in temperature, rainfall, cloud cover, daylight, wind, and humidity.
Seasonal overview
| Season | Months | Main Weather Pattern |
|---|---|---|
| Winter | December to February | Cold, windy, occasional snow |
| Spring | March to May | Unstable, wetter, stormy |
| Summer | June to August | Hot, humid, thunderstorms |
| Fall | September to November | Mild, dry, comfortable |
That table gives the whole year in one glance, but it does not yet explain the texture of each season. For that, the seasonal sections below are where the real detail begins.
Winter in Kansas City
Winter in Kansas City usually runs from late November into early March. It is a season marked by cold mornings, brisk winds, and a steady possibility of snow or ice.
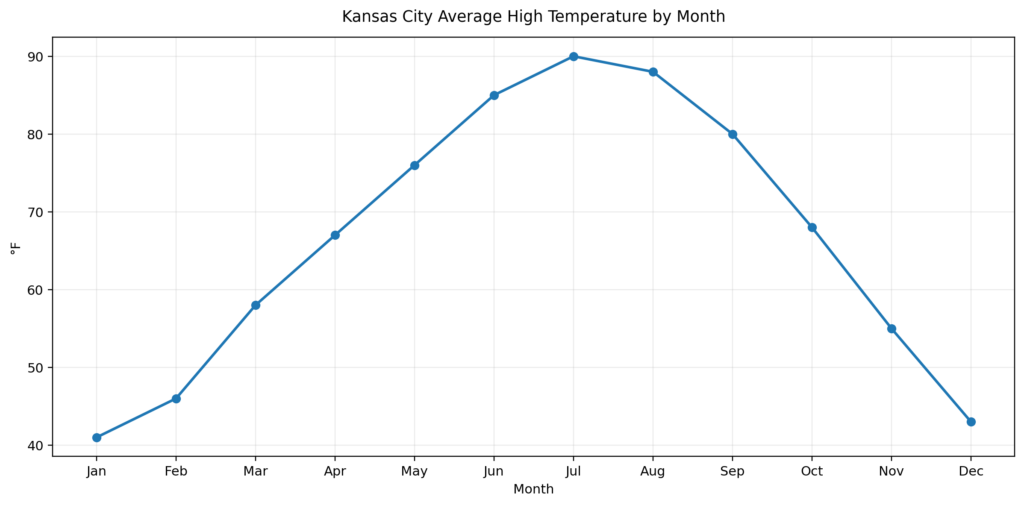
January is the coldest month of the year, with average highs around 41°F and average lows around 24°F. The broader cold season lasts roughly three months, from late November through late February, with average daily highs below 50°F.
Winter in Kansas City is not defined only by snow totals. In fact, many people are surprised by how variable the season can be. Some winter days feel deeply cold, especially when Arctic air settles in.
Other winter days turn mild enough for a short coat or even light outdoor activity. That fluctuation is part of the Midwest experience. The city can have frozen mornings and then a relatively gentle afternoon.
The snow that does fall is enough to affect roads and schedules, but the city is not buried by constant lake-effect or mountain snow the way some other U.S. regions are. The snowfall pattern shows the winter snowfall period centered on late fall through early spring, with January usually the snowiest month.
Winter temperature table
| Month | Avg Low | Avg High | Notes |
|---|---|---|---|
| December | 27°F | 44°F | Cold returns |
| January | 24°F | 41°F | Coldest month |
| February | 28°F | 46°F | Still winter, but easing |
The wind is a major part of the winter feel. Cold air plus wind can make temperatures feel much lower than the thermometer suggests. That is one reason Kansas City winter should be described as cold and windy, not just cold.
The city’s winter character is about exposure as much as it is about temperature. The climate summary specifically includes windy winter conditions as a defining feature.
Winter is also a season where people notice the daylight difference. The short days and early sunsets make the season feel even colder and narrower. That is not unique to Kansas City, but the city’s latitude and continental setting make the effect pronounced enough to matter in a weather guide.
Spring in Kansas City
Spring is the most unstable season in Kansas City. It begins with lingering cold in March, warms through April, and moves into a much more active warm and stormy pattern by May.
This is the season when Kansas City weather becomes most changeable and most dramatic. Rain increases quickly, thunderstorm frequency rises, and severe-weather risk becomes more important. The precipitation pattern shows the wetter season beginning in late March and continuing through late September.
The month with the most wet days is June, but spring is where the transition into that wet season really starts.
The reason spring is so active is atmospheric instability. Warm moist air begins pushing north while cooler air can still hang over the Plains and Midwest.
When those air masses collide, thunderstorms build. That is also why spring is such an important season for tornado awareness in this region.
NOAA’s severe weather resources explain that tornado-producing storms are tied to atmospheric instability and that the central U.S. is a major tornado-prone region. Kansas City sits inside that broader risk corridor.
Spring in Kansas City is also visually beautiful. Trees leaf out, lawns green up, and the city begins to feel alive again after winter. But the beauty comes with a downside: spring is the season when outdoor plans are most likely to be disrupted by heavy rain or storms.
Spring rainfall table
| Month | Rainfall | Rain Days | Seasonal Note |
|---|---|---|---|
| March | 2.2 in | 7 days | Transition month |
| April | 3.9 in | 9 days | Wetter and stormier |
| May | 5.1 in | 11 days | Very wet, active storms |
May is usually one of the wettest months of the year and often the point where the city starts feeling fully locked into warm-season weather.
That is why spring can seem like a long buildup toward summer rather than a separate, quiet season of its own. Kansas City’s climate data show this clearly, with rainfall and temperature both climbing through the spring months.
Summer in Kansas City
Summer in Kansas City is hot, humid, and often stormy. The hot season lasts about 3.6 months, from late May to mid-September, with July as the hottest month.
July’s average high is around 90°F, and the average low is around 73°F. That means summer nights stay warm too, which is an important part of the city’s summer character.
The heat is not just a matter of temperature. Humidity matters just as much. When the air is muggy, it holds moisture that prevents sweat from evaporating quickly, which makes the body feel hotter.
Kansas City’s summer climate therefore feels heavier than dry-heat cities with the same thermometer reading. The summer season is muggy and wet, and the muggy days are concentrated in the warm months.
Summer temperature table
| Month | Avg High | Avg Low | Notes |
|---|---|---|---|
| June | 85°F | 68°F | Warm, humid, stormy |
| July | 90°F | 73°F | Hottest month |
| August | 88°F | 70°F | Hot but slightly easing |
Summer also brings thunderstorms, and those storms can be intense. Heavy rain, lightning, hail, and gusty winds are all part of the summer weather picture. That means summer is not just a season of heat; it is a season of active weather.
Moreover, thunderstorms can produce damaging wind, flash flooding, lightning, and tornadoes, all of which are relevant in a Midwest metro like Kansas City.
The urban heat island effect adds another layer. Dense city surfaces absorb and retain heat longer than rural areas, which is why downtown Kansas City can feel hotter after sunset than surrounding neighborhoods. That effect does not change the climate category, but it does change the lived experience of summer in the city.
Fall in Kansas City
Fall is usually the best season in Kansas City. Temperatures begin to ease in September, humidity drops, and the weather becomes more stable.
By October, the city often feels especially comfortable, with mild afternoons and crisp evenings. November then turns noticeably cooler and starts the transition toward winter. Kansas City’s most comfortable warm-weather windows extend into early fall, and that matches what many visitors and locals already know: fall is the sweet spot.
Fall comfort table
| Month | Avg Temp | Main Feel |
|---|---|---|
| September | 71°F | Warm and pleasant |
| October | 58°F | Mild and balanced |
| November | 45°F | Cool, early winter feel |
Fall is the season when Kansas City’s weather becomes most useful for travel, walking, outdoor dining, and events.
The city feels active without being overwhelming. There is still enough warmth to be comfortable, but not so much humidity that everything feels heavy. For many people, that balance makes fall the most enjoyable time to experience the city.
Monthly climate table
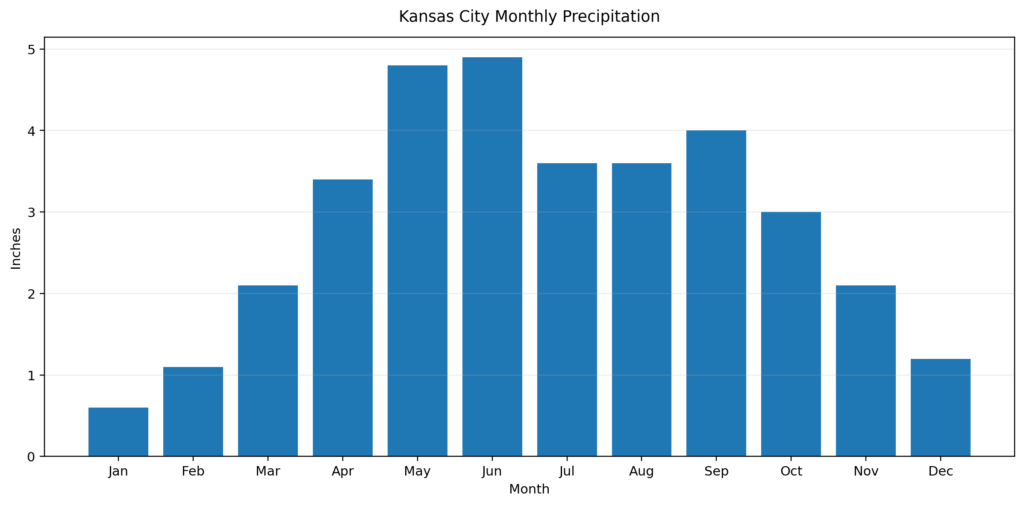
The monthly table below pulls together the basic year-round pattern from the climate data from WeatherSpark.
The monthly climate data also show the year’s average highs, lows, rainfall, snowfall, sunshine, wind, and cloud cover pattern.
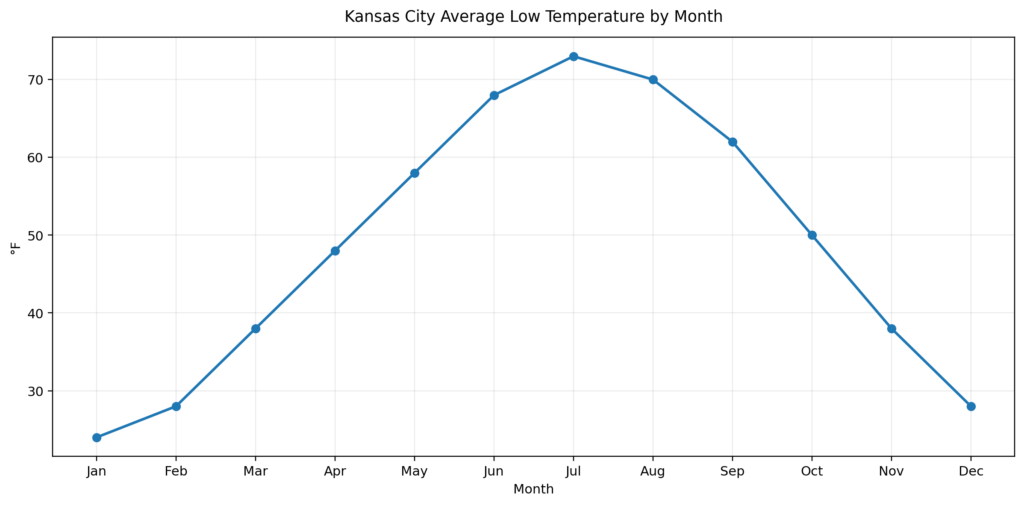
| Month | Avg Low | Avg High | Avg Temp | Rainfall | Snowfall |
|---|---|---|---|---|---|
| January | 24°F | 41°F | 31°F | 0.6 in | 2.9 in |
| February | 28°F | 46°F | 36°F | 1.1 in | 2.8 in |
| March | 38°F | 58°F | 46°F | 2.1 in | 0.9 in |
| April | 48°F | 67°F | 56°F | 3.4 in | 0.1 in |
| May | 58°F | 76°F | 67°F | 4.8 in | 0.0 in |
| June | 68°F | 85°F | 76°F | 4.9 in | 0.0 in |
| July | 73°F | 90°F | 81°F | 3.6 in | 0.0 in |
| August | 70°F | 88°F | 79°F | 3.6 in | 0.0 in |
| September | 62°F | 80°F | 71°F | 4.0 in | 0.0 in |
| October | 50°F | 68°F | 58°F | 3.0 in | 0.0 in |
| November | 38°F | 55°F | 45°F | 2.1 in | 0.5 in |
| December | 28°F | 43°F | 35°F | 1.2 in | 2.4 in |
This table shows the core climate rhythm very clearly. Temperatures rise sharply from March to July, precipitation peaks in late spring and early summer, and snowfall is concentrated in winter.
Sunshine, cloud cover, and daylight
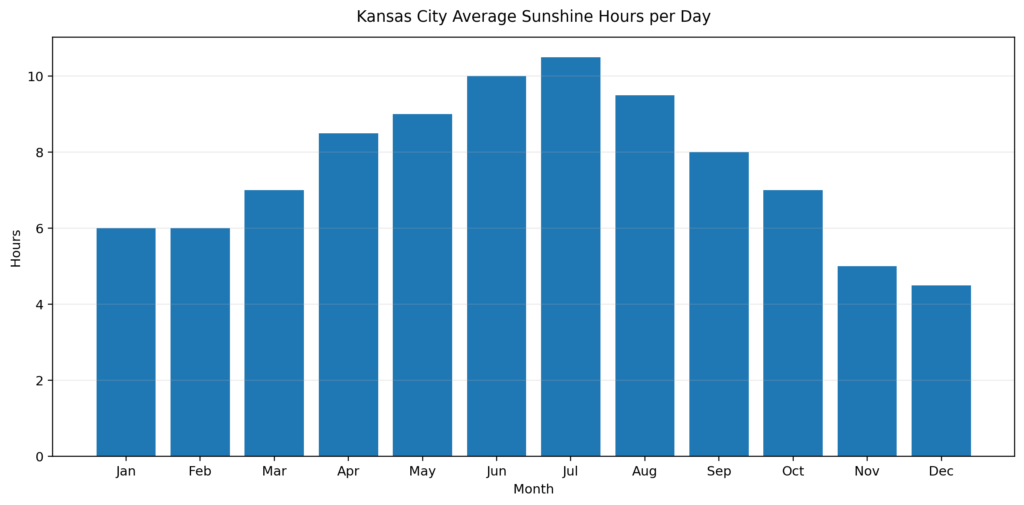
Kansas City is not a dark place. It gets a solid amount of sunshine during the year, especially in late spring and summer.
The clearest period of the year begins around early June and lasts into late October, with August standing out as the clearest month. The cloudiest part of the year stretches from late October into early June, which means cloud cover itself has a strong seasonal rhythm in Kansas City.
Daylight also changes significantly through the year. The shortest day in Kansas City is around late December, with about 9 hours and 25 minutes of daylight, while the longest day is around late June, with about 14 hours and 55 minutes. That large swing in daylight shapes how the city feels in winter versus summer, and it also affects outdoor planning, travel, and daily routine.
Sunshine and daylight table
| Month | Sunshine Hours/Day | Daylight Length |
|---|---|---|
| January | 6.0 | 9.8 h |
| February | 6.0 | 10.8 h |
| March | 7.0 | 12.0 h |
| April | 8.5 | 13.3 h |
| May | 9.0 | 14.4 h |
| June | 10.0 | 14.9 h |
| July | 10.5 | 14.6 h |
| August | 9.5 | 13.6 h |
| September | 8.0 | 12.4 h |
| October | 7.0 | 11.1 h |
| November | 5.0 | 10.0 h |
| December | 4.5 | 9.5 h |
This table explains why the city feels open and active in summer but shorter and tighter in winter. Longer daylight hours give the city more time for outdoor life, while short winter days compress the usable part of the day.
Wind and humidity
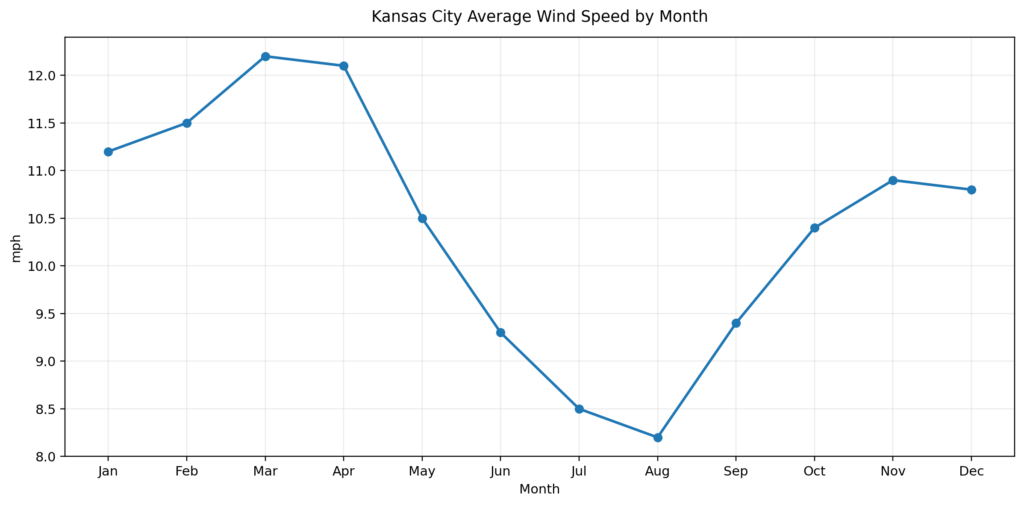
Wind in Kansas City changes by season; the windiest part of the year is generally in late winter and early spring, while the calmest period is in late summer.
That matters because wind amplifies cold in winter and affects storm movement in spring. In summer, lower wind speeds can make hot, humid air feel even more stagnant.
Humidity is especially important in summer. Kansas City’s warm season is muggy enough that temperature alone does not tell the whole story.
A 90°F day with humidity feels much harsher than a dry 90°F day, and that is one reason Kansas City summers are remembered as sticky and heavy rather than simply hot. Also, muggy conditions should be taken as a major warm-season feature.
Wind and humidity table
| Month | Wind Speed | Humidity Character |
|---|---|---|
| January | 11.2 mph | Dry-cold feel |
| February | 11.5 mph | Cold, often dry |
| March | 12.2 mph | Windy, unstable |
| April | 12.1 mph | Active, storm-prone |
| May | 10.5 mph | Warmer, more humid |
| June | 9.3 mph | Muggy |
| July | 8.5 mph | Muggy, still air common |
| August | 8.2 mph | Calmer, humid |
| September | 9.4 mph | Easing humidity |
| October | 10.4 mph | Comfortable, drier |
| November | 10.9 mph | Cooling, breezier |
| December | 10.8 mph | Cold and windy |
This is a helpful table for readers who want to understand not just temperature, but how the air feels. In weather writing, that difference matters a lot.
Weather hazards in Kansas City
Kansas City’s weather hazards are seasonal, and each season brings a different kind of risk. Winter brings cold, wind, ice, and occasional snow.
Spring brings thunderstorms, hail, flooding, and tornado potential. Summer brings heat, humidity, and intense thunderstorms.
Fall is usually calmer, but it still carries occasional storm systems and the first taste of colder air. Thunderstorms can lead to tornadoes and damaging wind, while Kansas City’s river setting and flood history make water-related hazards part of the local story too.
Kansas River flows into the Missouri River at Kansas City and that river flooding has caused considerable damage in the area historically.
Hazard table by season
| Season | Main Risks | What to Watch For |
|---|---|---|
| Winter | Cold, ice, wind | Wind chill, slick roads |
| Spring | Thunderstorms, tornadoes, floods | Severe weather alerts |
| Summer | Heat, humidity, storms | Heat index, lightning, flash floods |
| Fall | Cooler weather, occasional storms | First cold snaps, windy fronts |
Kansas City is not a city where weather risk stays constant all year. Instead, the risk changes with the season, which is part of why a seasonal guide works so well here.
Best time to visit Kansas City
The best time to visit Kansas City is usually spring or fall, with fall often having the edge because it is drier and more stable.
Moreover, the the best windows for warm-weather activities as mid-May to early July and late July to late September, which means late spring and early fall are especially good for outdoor plans.
| Goal | Best Time | Why |
|---|---|---|
| Comfortable sightseeing | September to October | Mild, pleasant weather |
| Green landscapes | April to May | Blooming, fresh, lively |
| Warm-weather outdoor activities | Mid-May to early July | Warm but still manageable |
| Pool and summer activities | Late June to August | Hottest temperatures |
| Lowest weather stress | October | Balanced and calm |
That table is especially useful for travel content because it answers the practical question behind the climate data: when should someone actually go?
Monthly planning notes
Kansas City weather becomes much easier to understand when you think of it month by month. January is cold and often windy.
February is still winter, but the light begins to shift. March is a transition month, with temperature swings and the first serious storms.
April feels like spring is fully arriving, while May often becomes one of the wettest and most active months of the year. June turns warm and stormy, and July is the hottest month.
August is still hot but begins to feel slightly less intense. September is one of the city’s best weather months. October is comfortable and stable.
November starts to feel like winter is coming back. December closes the year with colder temperatures, shorter days, and the possibility of snow.
What Kansas City weather feels like day to day
One reason Kansas City weather stands out is the day-to-day feel. It can be cold enough in the morning to need a winter coat, then warm enough in the afternoon to make that coat unnecessary.
In spring, weather can shift fast enough that a calm morning turns into a thunderstorm later in the day. In summer, the air can feel heavy after lunch and then release into a late storm.
In fall, the city often feels calm and comfortable until the first real cold front arrives. This makes Kansas City weather active in a way that residents notice immediately, even when the long-term monthly averages look ordinary at first glance.
Kansas City weather is defined by contrast. The city has cold winters, stormy springs, hot and humid summers, and a fall season that often feels like the most comfortable time of year.
It receives enough precipitation to stay green, enough snow to feel like winter, enough sunshine to support active summer days, and enough weather volatility to keep forecasting important.
As Kansas City sits where several air masses meet, its climate is not static. It moves, shifts, and changes with the seasons in a way that gives the city real character.